Between any two presidential elections, there is an enormous amount of churn in the electorate, both nationally and at the state level. A lot of this is obvious: People die, young people turn 18 and register to vote (and then often don’t vote again for a decade or two), people lose or gain interest in candidates or issues.
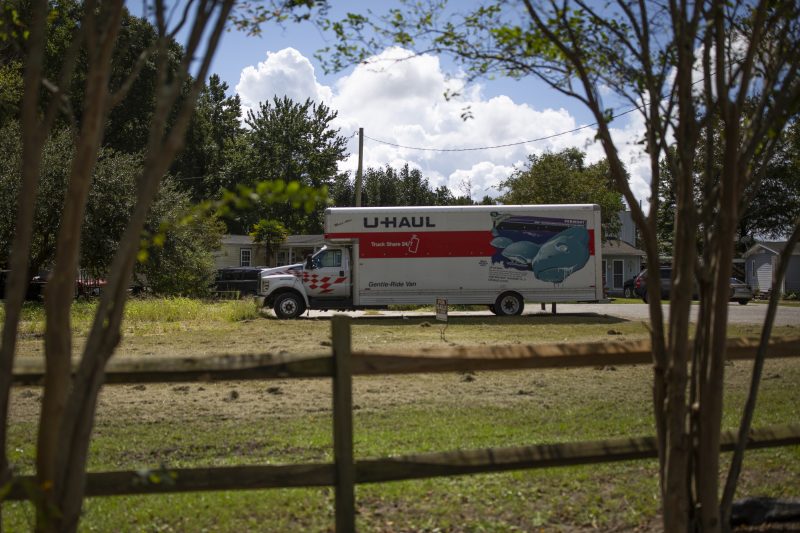
There’s another factor, too, that often goes underrecognized. Over the course of four years, a lot of people simply pull up stakes and move. And that, at least in theory, can affect the outcome of an election.
This is not easy to track. The Census Bureau collects data on interstate moves year over year, but in the aggregate. We can’t see, for example, whether someone moved from one state to another and then back. And we can only guess at what the political effects might be. Is someone moving from Ohio to Michigan adding a Republican vote to the latter state or is it a Democrat seeking slightly bluer climes?
We have another set of data that offers us a better lens into this question of partisan flow. L2, a political data vendor, tracks individual registrations over time, including after people move across state lines. An analysis of that data offers a picture — albeit an incomplete one — of the influx and outflow of state residents by party.
There are two caveats that are worth keeping in mind.
The first is that not every move is captured in this data, even among voters who were registered in both states. In many cases, of course, people moving across state lines will register to vote for the first time in the new state; they won’t be reflected in this data. Nor will people who couldn’t be matched to their prior registrations (generally because they didn’t complete a change of address form with the post office).
The other caveat is that this analysis includes partisanship data that’s modeled by L2. In some states, registration is nonpartisan. In those states, L2 uses other data — voting patterns or demographics — to estimate partisanship.
With those qualifiers in place, we can simply jump into the data. What we were interested in was less the numbers of people going from state to state (given the qualifier about those numbers) than the patterns of that movement. For each state, we calculated the number of Democrats, Republicans and third-party or nonpartisans who moved into a state since 2020 and the number of each group who moved out. Then we presented those totals as a percentage of the state’s total population.
This was the result. Thicker bars on the left side than the right indicate more arrivals than departures. The bars are generally ordered by size: If the Republican bar is on top, more Republicans than other groups were coming or going.
There are a lot of nuances to pick out of those charts; we’ll leave you to that.
Let’s drill down on the question we started with, though — considering how this might affect the presidential race. Comparing the net change among partisans (that is, those arriving minus those leaving) to the 2020 vote, we see that more-Democratic states were often those with bigger positive inflows of Democrats, though it’s cloudy. That partisan correlation was much stronger in more-Republican states.
In the middle there we see the swing states that flipped around in 2016 and 2020. We can pull the eight closest states in 2020 out and see that the net change by party varies. In Georgia, there’s been a bigger positive change for Democrats; in Florida, strongly for Republicans.
But what are the actual numbers, you demand. Well, in Georgia, the net advantage (comparing parties after subtracting outgoing voters from incoming ones) was a gain of about 18,000 Democrats. In Florida, it was 124,000 Republicans.
But again, this is just a sliver of movement. The Census Bureau’s data on moves from 2021 to 2022 shows 50 percent more inflow to Florida than there were new arrivals tracked by L2 over all four years. In Georgia, the Census Bureau’s one-year total is more than twice the L2 numbers. People are missed — including people registering for the first time.
There’s one other point worth making: People who have newly moved are less likely to vote. Here’s other data from the Census Bureau, looking at the 2020 election.
There are a lot of reasons for this: They haven’t registered yet, for one, or they may not know where they are supposed to cast their ballot. People who move frequently are less likely to own homes and skew younger, and younger people vote less often.
In other words, do not use these numbers to make bold predictions about how this consistently close presidential contest will end up. Use them, instead, as a reminder to register and vote.
